Secrets of Cooperstown: How Underlying Advanced Stats Tell the Story of Stardom
By Orlando Pereira | December 31, 2024
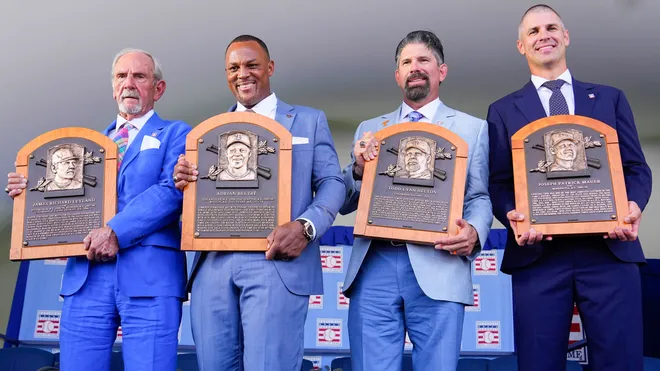
Every year, millions of kids around the world head to their local baseball field, dreaming of one day playing in the big leagues in front of thousands of fans, just as their heroes do. However, their chances of getting there are slim. In the nearly 150 year history of Major League Baseball in the United States, only 20,787 people have been able to earn the title of “MLB Player”. Of these, only 274 players have made it into the Hall of Fame. Only the absolute best of the best get the call to Cooperstown. But, what exactly gets someone into the Hall of Fame? Although there currently exist several different voting committees which vote on eligible players under different circumstances, the majority of Hall of Famers are admitted through a ballot of about 307 members of the Baseball Writers' Association of America (BBWAA). Voters are asked to vote for a maximum of 10 players from a list of around 30 eligible players every year, taking a holistic look at each player’s career. They are asked to consider things such as a player’s overall performance, clutch, leadership abilities, character, and achievements, both on a personal and on a team level. This has recently created debate over players from the Steroid Era, who despite being statistically some of the best players of all time, have had trouble being voted in. Despite this however, I was interested in taking a stats-first approach to see what sorts of numbers a player needs in their career in order to eventually be immortalized into baseball history.
The Data
I will be primarily focusing on players who were voted into the Hall of Fame by the BBWAA, earning at least 75% of the vote in a particular year. For the sake of this analysis, I will also be excluding several players who either failed to make it into the Hall of Fame for character issues while having incredibly outlying positive stats (Bonds, Rodriguez, etc.), as well as players who entered the Hall of Fame under special circumstances (Lou Gehrig was voted in by a special committee after his death due to ALS, despite not yet meeting full eligibility requirements). I then took the subset of all other players who were voted on by the BBWAA, taking specifically their top vote percentage (they either got over 75% and made it in or capped out below that and fell off of the ballot). I am also analyzing starting pitchers separately from position players, due to differences in what stats are used and how stats such as WAR are calculated differently. I am also omitting relief pitchers, as they are the most abundant group of players in baseball while also having the least amount of HOFers, due to the great volatility of relief pitching careers.
The Stats
Through much iteration through different statistics among the set of players I was researching, I found a few statistics which seem to create the greatest separation between players which get voted into the Hall of Fame and those who don’t. First off, we have JAWS, which comes as no surprise since it was created with the intention of evaluating a player’s Hall of Fame potential.

In the box plot above, we see that the distribution of JAWS among non-HOFers is quite a bit lower than that of HOFers, such that there is only overlap between the top quartile of non-HOFers and the bottom quartile of HOFers. That is, the majority of players in the HOF have a higher JAWS than the majority of non-HOFers by a pretty wide margin, with only some overlap at the tail ends. This was not true for many other statistics, where although HOFers generally outperformed the non-HOFers, there was much greater overlap.
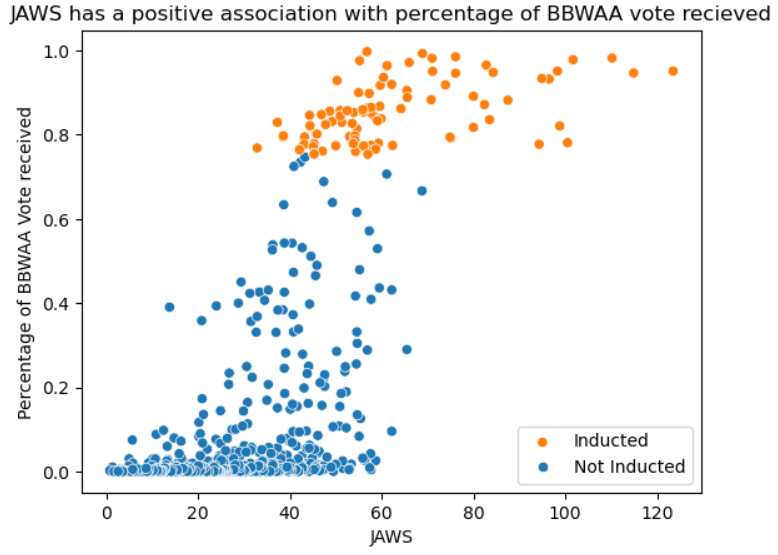
We also see that JAWS tended to also associate positively, although non-linearly, with the percentage of votes received on the Hall of Fame ballot. As mentioned above, there are some players still being considered here as non-HOFers because of their lack of BBWAA votes, despite eventually making the Hall of Fame through other means. Interestingly enough however, those who did eventually make it into the Hall of Fame appear to have JAWS closer to those of non-HOFers, which further shows that JAWS is important in receiving votes from the BBWAA.
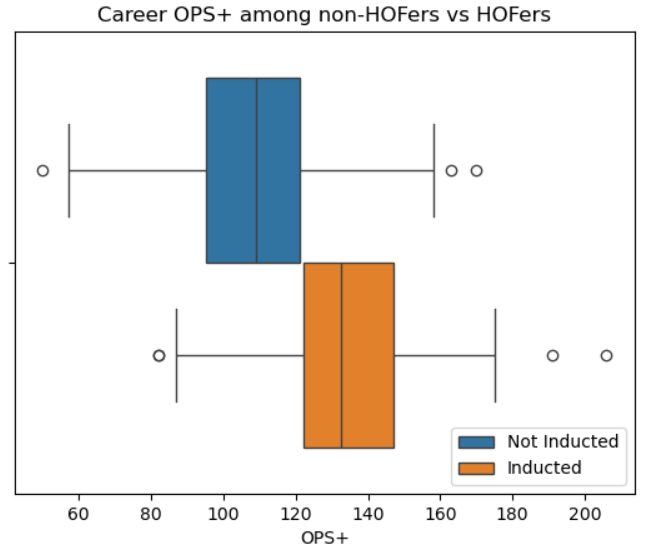
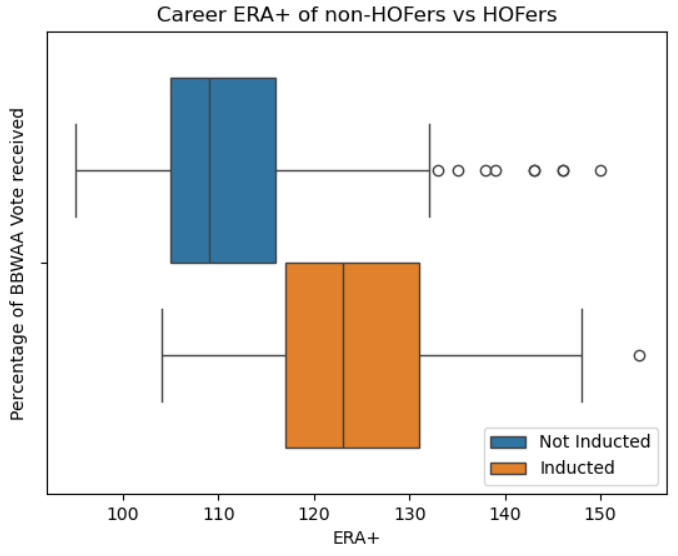
Beyond that however, I am also showing distributions for OPS+ for position players and ERA+ for pitchers. Although there is greater overlap between the distributions for non-HOFers and HOFers, we still see that the overlap occurs only at the edge quartiles for each group. This is to be expected, as these stats don’t account for factors such as defense or baserunning ability. One example is Ozzie Smith, a HOFer known for his stellar defense and speed on the base paths, but having an OPS+ below 90, which is quite a bit below average. Although these are statistics which are not traditionally looked at by voters, it seems that they are very good indicators of a player’s chances at getting into the Hall of Fame, even more so than other basic counting statistics which are often metrics more strongly considered by voters, such as total hits or home runs. Focusing on pitching, I did also find that pitcher wins also had a distribution matching the criteria above. However, changes in starting pitching philosophy have devalued wins as a metric, and starters are winning less games than ever now. For this reason, I opted to analyze ERA+ instead, as future pitching HOFers will not be subject to the same scrutiny when it comes to their wins.
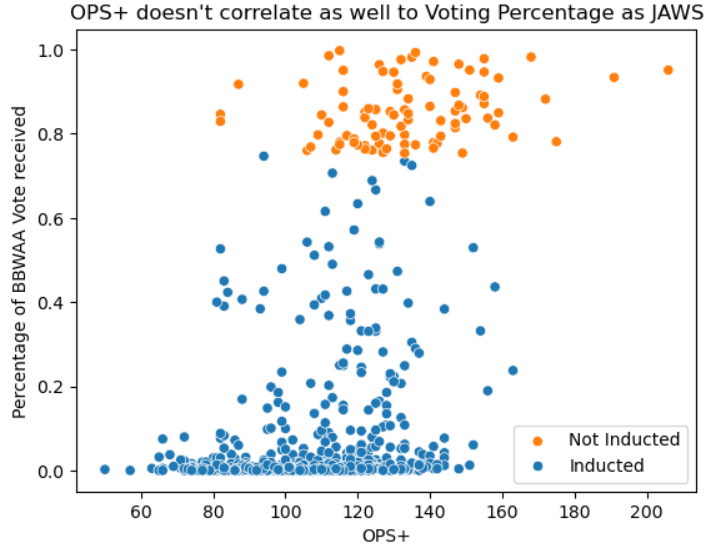
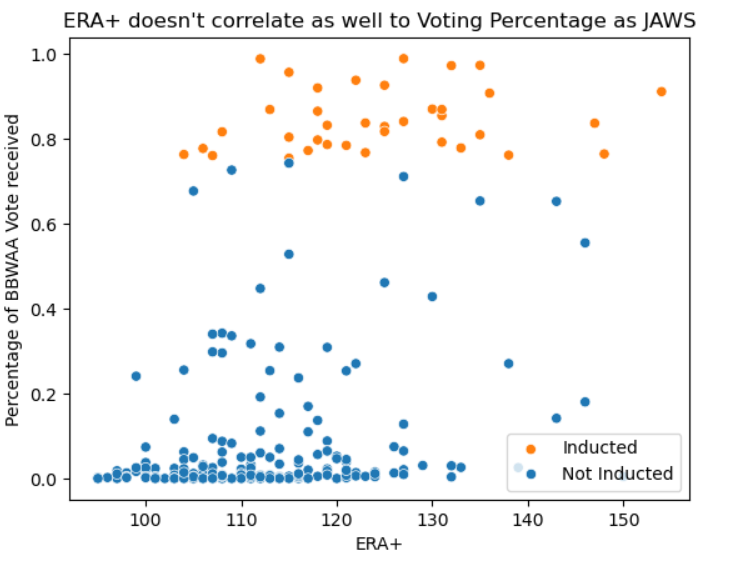
We again see that in both of these cases, there is a somewhat positive association between a player’s OPS+/ERA+ and the vote percentage which they received in BBWAA voting. Although, this relationship is not as clear as it was with JAWS, especially ERA+, where there are several outliers. In this case, we do see again that several outliers on these graphs did eventually make it into the Hall of Fame through other means, but for one reason or another did not get in traditionally with the BBWAA. Again, it is not particularly linear, but the relationships are very clear and are a positive indicator as to these statistics, even if not traditionally looked at by voters, are a very good measure of a player’s HOF potential.
Projections
Based on the above analysis, I decided to train a simple logistic regression model which used JAWS and OPS+/ERA+ to then classify whether or not a player would be voted into the Hall of Fame via the BBWAA voting method. By only using about 80% of the data chosen at random to train the model, I was able to then use the other 20% to test the model’s accuracy. Although the model had an accuracy of about 94% with the testing data, it only had a recall rate of about 73%. That is, of players who did get voted into the Hall of Fame, it only predicted that 73% of them would have been voted in based on the stats used in the model. When it comes to pitchers, the recall was lower, at about 60%. We see then that the model is underestimating the amount of players that would be going into the Hall of Fame, however this is expected as the vast majority of the players in the dataset are NOT in Cooperstown, and therefore the model leans towards underestimating the probability that a player makes it into the Hall of Fame. Looking at the upcoming 2025 ballot, whose results will be released in January, the model predicts that four new members will be elected: Carlos Beltran, Alex Rodriguez, Manny Ramirez, and Chase Utley. None of these four players are on the ballot for the first time, and Carlos Beltran had the highest vote percentage among these four last year, at 57%, still somewhat far from the 75% needed to get elected. All four of these players are however struggling with votes due to scandals involving steroids, cheating, and general character issues. While their numbers support their entry into the Hall of Fame, they will struggle to get in. Also notably, the model did not predict Ichiro Suzuki to make it into the Hall of Fame. It is his first year on the ballot, and he will likely be on of this year’s inductees, with even possibly entering unanimously as a hero of the game. Despite being an excellent hitter, he did not have much power, and therefore his OPS+ stayed around average at 107. He was also a tremendous baserunner and defender, and although JAWS does consider this, OPS+ does not. The model may be too simple to account for such intricacies, despite previous analysis supporting JAWS and OPS+/ERA+ as strong indicators of a player’s Hall of Fame potential. Perhaps said correlations were not linear enough, or other underlying statistics provide a better view into the voting process. In the end, even a complex model would be difficult to control, especially with aforementioned issues that players face based on their actions. I do however still believe that as time goes on, we will see that JAWS, OPS+, and ERA+ will be even more indicative of a player’s career, especially as we move past the last remaining players of the Steroid Era, and as these numbers become more heavily normalized within the game.
Conclusion
From childhood dreams of spending life with America’s Pastime, to becoming forever known as a hero of the game, the National Baseball Hall of Fame is without a doubt the most prestigious group that one can be a part of as a baseball player. Not only is it difficult to get in, but it is also difficult to really know who will be blessed with a call to the Hall. Through the above analysis, we have seen that generally speaking, calculated statistics such as JAWS, OPS+, and ERA+ can give us a glimpse into a player’s career, and tell us a lot about their qualifications to be included in the Hall of Fame. However, they do not paint a full picture, especially when it comes to a player’s character and their impact on their teams, communities, and the game of baseball as a whole. If it were based on a few numbers, there would be no need to have a vote in the first place. Nevertheless, these numerical analyses into the Hall of Fame still offer insights into well the statistics more prevalently used nowadays reflect player performance historically, even if these statistics weren’t used, and didn’t even exist, when the BBWAA voted for these players. This also serves as a look into the future, as the game’s analytical side continues to grow into the mainstream.
Sources
Sean Lahman’s Baseball Database
Baseball Reference
Gregory Fisher, USA TODAY Sports (Image)

