Home Run Derby or Crystal Ball?
By Jade Abrica | December 31, 2024
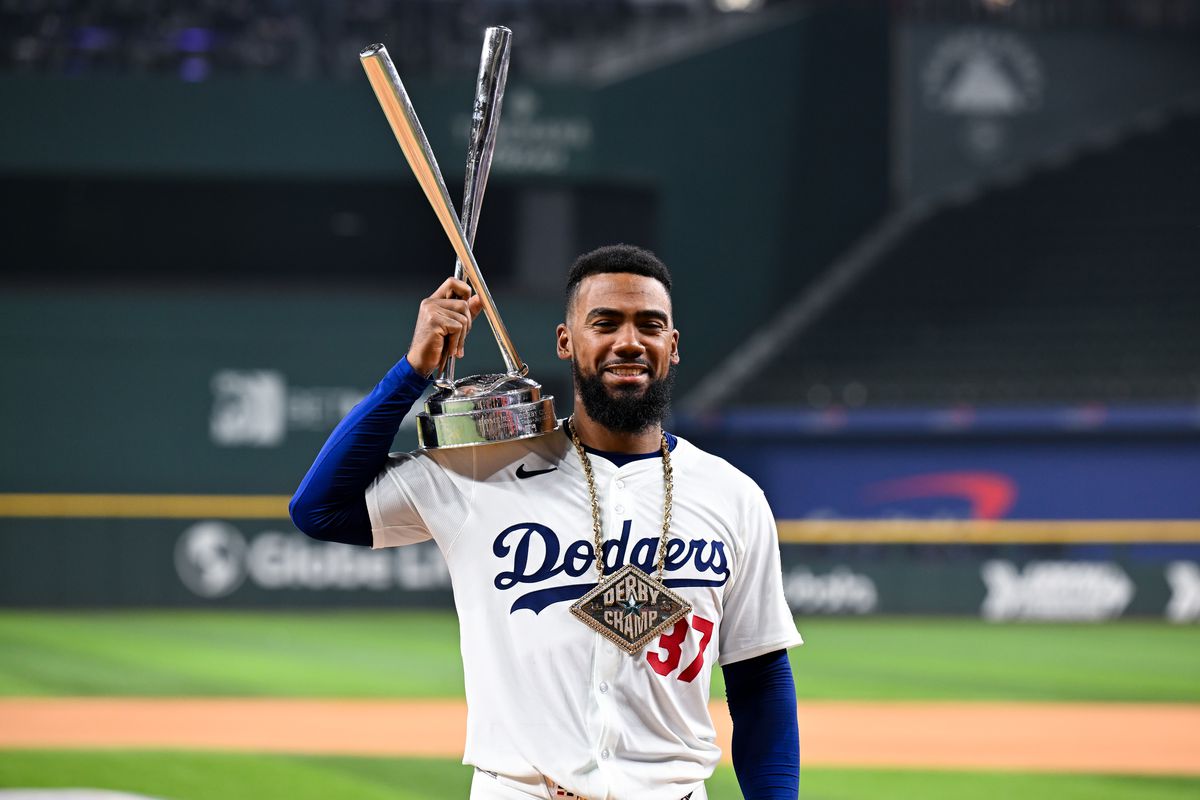
Typically the 162 game MLB season can make one think that players hit home runs left and right. However, as a Dodger fan myself, I went to five games this season and only saw the Home Run Derby Champion, Teoscar Hernandez, hit one home run. I thought I would have at least seen two, maybe three from him. I began to wonder if the annual Home Run Derby could say anything about a player. The Home Run Derby, an exciting event during the All-Star break, is a chance for players who have hit a substantial amount of home runs in the first half of the season to show how great their hitting is. By comparing the amount of regular season home runs contestants have hit, we will see if the Home Run Derby can predict which contestant performs the best in season and if there's a change in stats from before and after the All-Star Break.
This article analyzes the 32 Home Run Derby contestants from the past four years. Although the dataset may seem small, the change from the four minute rounds in 2019 to the three minute rounds that were changed for the 2021 derby were significant enough to only look at only the past four competitions– additionally there was no HRD in 2020 due to pandemic safety guidelines. I looked at players’ Regular Season HR Totals, their HR Totals split by the 1st and second halves of the season with the 2nd half scaled, the residuals between their 1st and 2nd half performance, and their Average HR total in the Home Run Derby (HRD). Since the first half of the season is about 56% longer than the second, I scaled the second half of the season’s HR Totals by 1.2727 to make a more accurate comparison.

After looking at this graph I knew that I had to see if there was any correlation between contestants’ performances in the HRD and their HR totals after. Rather than looking at just the champions of the HRD, I looked at the average performance of all contestants and compared them to their residuals from that season to have a better understanding of players’ performances.
 vs. Average HR in the HRD.png)
By comparing the residuals of players’ seasons and their Average HR in the HRD we are given a positive trendline that shows that higher averages in the HRD can lead to better performance in HR after the All Star Break. However, with the R^2 being only 0.084 there's low correlation between better performance in the HRD and performance post the All Star Break. However, the dataset is small and may cause the R^2 not to be as accurate.
I will now be looking at two players who both competed in the 2023 HRD and comparing their 2022, 2023, and 2024 season performances to see if their participation in the HRD could have affected their immediate performance.
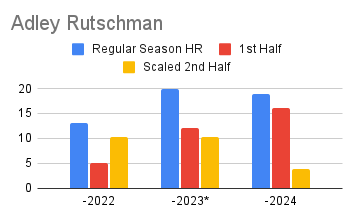
By looking at Adley Rutschman’s performances in 2022, 2023, and 2024 we can see post the All-Star Break in 2022 he was about double the home runs he hit in the first half of the season with that improvement continuing into the 2023 season. Yet, he began to decline after participating in the HRD in 2023. He skyrockets again in the beginning of 2024 but once again significantly declines after his participation as starting catcher for the 2024 All-Star game which could be a factor in his decline, but it’s unlikely because there’s not enough data to say that it could be caused by anything specific.
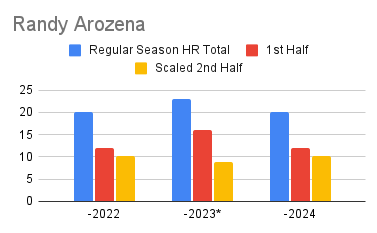
Contrastingly Randy Arozena experiences the beginning of his improvement at the start of the 2023 season with about six more home runs than the second half of 2022. Despite this, after playing in the HRD he experiences an immediate decline for the rest of the season and the same performance results in 2024 as he did in 2022, without participating in any of the All Star Break activities. Though I only compare two players, both have experienced a decline in HR results after competing in an All Star Break activity.
Finally, I recognize that I can’t analyze the HRD without looking at the real HRD Champ, Pete Alonso. Pete Alonso has competed in the HRD since his first appearance and victory in 2019 and has continued to participate, even in the most recent competition. I utilize Alonso to see how back to back participation in the HRD can affect players performance by comparing how his average in the HRD affects his in season performance over time.
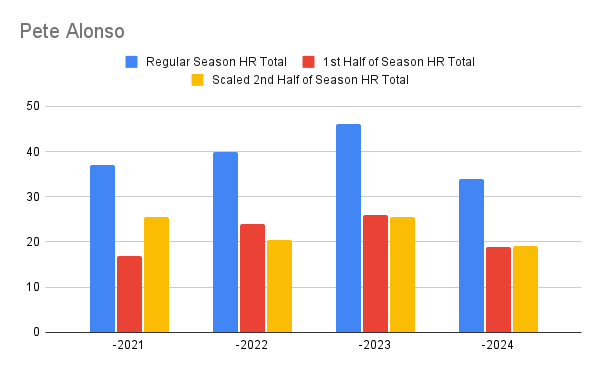
Just by looking at overall performance from the past four years, we can tell that Pete Alonso has become relatively consistent in the comparison of the season halves with his 1st half totals being close to or the same as his 2nd half totals.
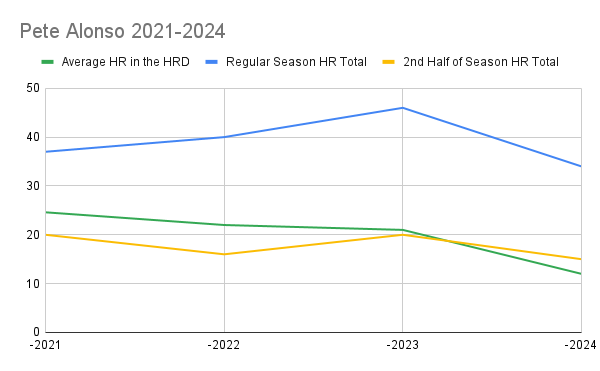
Furthermore, the graph shows that as time progresses, his average performance in the HRD, HR post the All Star Break, and his overall season HR total experience relatively similar dips and peaks. However, overall it shows that for consistent players like Alonso, the HRD shouldn’t directly cause a decline in performance after the All-Star Break but possibly a test for consistency in a player.
The dataset I analyzed derived from the Home Run Derby contestants since the rule changes that took place in 2021 doesn’t show much correlation between the HRD and player performance post the All Star Break. With that being said, I think it’d be interesting to look at the players who have improved in their HR totals and compare the specifics of their home runs to see exactly what changed or how they improved– if there is a difference in those metrics. In seasons to come, I also think it’d be helpful to analyze how HRD performance evolves for repeat participants, similar to Pete Alonso, to see the effects of the derby further. Overall the HRD continues to be an exciting event that some of the top hitters in the MLB participate in.

